In This Tutorial you will learn How to Draw Visio Process Flow, Org Chart, Floor Plan & Network Architecture diagrams using Microsoft Visio. SUBSCRIBE!!! http://howtoanalyzedata.net/youtube
-- Download Sample Visio Diagrams [.VSDX Files] to follow along and Jump Start Your Own Diagram (E-Commerse Shopping Process, Basic Flowchart, Org chart, Agile Release Process, Salesforce Release Process, Swimlane Diagram, Simple Rectangular Room and More): https://www.howtoanalyzedata.net/dq5e
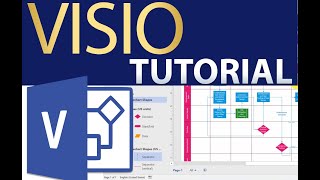
Table of Content:
00:00 Introduction
00:36 Visio Concepts
07:25 Visio Org Chart Diagram
18:15 Visio Floor Plan Diagram
25:36 Visio Network Architecture Diagram
39:38 Visio Keyboard Shortcuts
____
LETS CONNECT:
Subscribe on YouTube: https://www.howtoanalyzedata.net/youtube
Join Facebook Community (Facebook Page): https://www.howtoanalyzedata.net/face...
Connect on LinkedIn: https://www.howtoanalyzedata.net/link...
Instagram: https://www.howtoanalyzedata.net/inst...
Subscribe to Email: https://www.howtoanalyzedata.net/email
#visio #swimlane #diagram #VisioTutorial #VisioDiagrams #MicrosoftVisio
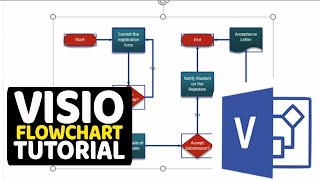
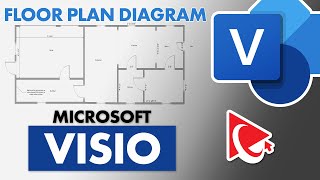
Microsoft Visio is an application to create diagrams. From flow charts to floor plans to swim lane diagrams to networking diagrams and organizational charts: Visio can handle it all. In this tutorial we will look at the features of Visio and will cover creation of Visio diagrams step by step.
Microsoft Visio is software for drawing diagrams. These include floor plans, electrical diagrams, flowcharts, org charts, building plans, floor plans, data flow diagrams, process flow diagrams, business process modeling, swim lane diagrams, 3D maps, and many more.
If appropriate for your needs, Visio can produce extremely helpful, slick, useful diagrams of all types, and these can provide the professional look you want for presentations, reports, audits, building plans, floor plans, documentation, and modeling better ways to do things. Visio includes a big library of shapes/symbols used in dozens of diagram types. These symbols represent specialized pieces of diagrams such as process flow diagrams, business process modeling, data flow diagrams, and many more. These are used widely in various fields for various purposes.
An organization chart (org chart) is a diagram of a reporting hierarchy that is commonly used to show relationships among employees, titles, and groups.
Org charts can range from simple diagrams, as in the following illustration, to large and complex diagrams that are based on information from an external data source. The shapes in your org chart can display basic information such as name and title, or details such as department and cost center. You can even add pictures to the org chart shapes.
Other recommended Visio Videos:
Microsoft Visio - Tutorial for Beginners [+General Overview]*: • Microsoft Visio - Tutorial for Beginn...
Visio Tutorial: • Visio Tutorial
How to use Microsoft Visio: • How to use Microsoft Visio
Microsoft Visio 2019 - Full Tutorial for Beginners [+General Overview]: • Microsoft Visio 2019 - Full Tutorial ...
Microsoft Visio For Beginners | Get Started with Shapes and Connectors: • Microsoft Visio Tutorial for Beginner...
How to Draw Visio Process Flow Diagram: • How to Draw Visio Process Flow Diagram
How To Draw a Simple Floor Plan in Visio: • How To Draw a Simple Floor Plan in Visio
Microsoft Visio Training Course: • Microsoft Visio Training Course


Информация по комментариям в разработке