In early July 2022, Hurricane Bonnie traveled from the Caribbean Sea—through the border of Nicaragua and Costa Rica in Central America—to the Pacific Ocean—covering more than 6,600 miles, or 10,622 kilometers (km). To put that in perspective, Bonnie traveled over 1/4th of Earth’s circumference! The National Oceanic and Atmospheric Administration (NOAA) National Hurricane Center first tracked Hurricane Bonnie as Potential Tropical Cyclone Two on Monday, June 27, near Trinidad and Tobago.
This data animation begins on July 1, when Potential Tropical Cyclone Two became Tropical Storm Bonnie. When Bonnie made landfall over Nicaragua and Costa Rica, the storm had sustained wind speeds of 50 miles per hour (mph), or 85km/h, and was classified as a tropical storm. What is interesting about Hurricane Bonnie, is that as the storm left Central America on July 2, it only weakened to sustain maximum wind speeds of 40 mph (65 km/h). But, on the evening of July 3, Hurricane Bonnie became the third named hurricane of the 2022 Eastern Pacific season, with wind speeds doubling to 80 mph (130 km/H). Located off the coast of Mexico, Hurricane Bonnie continued to churn, and picked up speed, reaching a maximum sustained wind speed of 115 mph (185 km/h) with hurricane-strength winds stretching outward to 30 miles (45 km), a Category 3 hurricane. By July 8, Bonnie was downgraded back to a Tropical Storm before eventually being declared a Post-Tropical Cyclone on July 9, ending Bonnie’s long voyage as it dissipated through July 11.
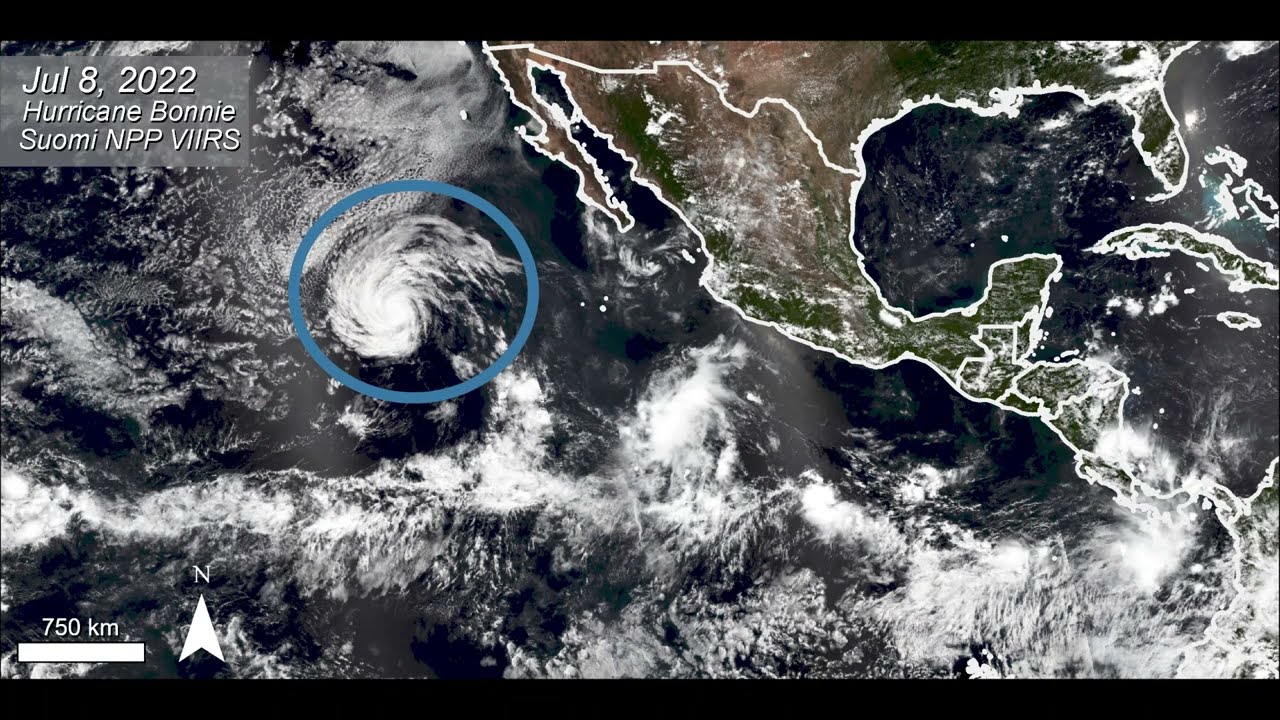
In this Suomi National Polar-orbiting Partnership (Suomi NPP) Visible Infrared Imaging Radiometer Suite (VIIRS) Surface Reflectance data animation, view the long path of Tropical Storm / Hurricane Bonnie. These data are provided by NASA's Land Processes Distributed Active Archive Center (LP DAAC) and estimate land surface reflectance. The images in this video were created using the true-color band combination M5-M4-M3 where land is shown as shades of green and brown, water as dark blues, and clouds as white. Country borders are shown in light grey.
Suomi NPP VIIRS Surface Reflectance data are available from January 19, 2012, to the present, providing a decade worth of data to users at no cost!
To learn more about the data used in this video please visit NASA’s LP DAAC:
*Suomi NPP VIIRS Surface Reflectance Daily 5,600 meter data:
https://doi.org/10.5067/VIIRS/VNP09CM...
To learn more about VIIRS land data: https://viirsland.gsfc.nasa.gov
The LP DAAC is one of the NASA Earth Observing System Data and Information System (EOSDIS) DAACs and operates as a partnership with the United States Geological Survey (USGS). It is located at the USGS Earth Resources Observation and Science (EROS) Center in Sioux Falls, South Dakota. The LP DAAC ingests, archives, processes, and distributes NASA Earth science land processes data and information.
Have questions about Suomi NPP VIIRS data? Contact the LP DAAC: https://lpdaac.usgs.gov/lpdaac-contac...

Информация по комментариям в разработке