This is Ali Oliyaee, and welcome back to LinixBit — where we analyze real trading charts through short, practical breakdowns to help you master price action trading and build confidence in your strategy.
📊 Chart Breakdown — Reading the Structure
Let’s break the chart down step by step.
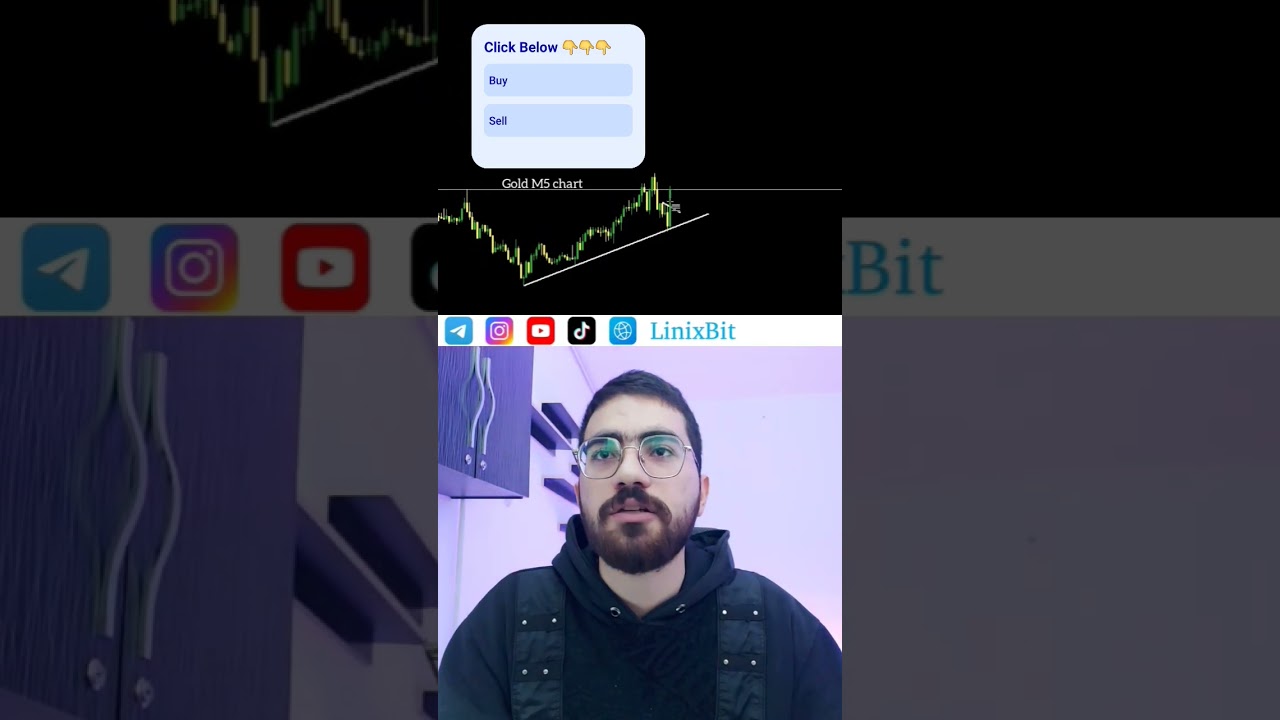
We start with a clear upward movement — a strong series of higher highs and higher lows showing that buyers are in control.
To identify this structure, connect the lowest point of the trend to the second higher low, then extend that line forward to project future support levels.
That simple action defines the main trend direction — upward.
Now, within this major uptrend, we notice a short-term downward microchannel forming.
This is what we call a reform attempt — a controlled correction that moves against the main trend.
However, statistically, around 80% of these microchannel pullbacks fail and end up resuming in the direction of the main trend.
That’s exactly where professional traders pay attention.
When price breaks out of that microchannel, the first strong bullish signal appears — a bullish engulfing candle.
The body of this candle completely covers the drop of the previous candle, showing a powerful momentum shift back to the upside.
This is our key confirmation.
From this point, a buy position can be entered at the close of the engulfing candle.
The stop loss is placed just below the trendline support — right under the last swing low or the engulfing pattern’s low.
For the target, we connect the previous high to the next projected higher high, using the upper boundary of the channel as our take-profit area.
That’s a clean, structured trade — no indicators, no guesswork, just pure price action logic.
⚙️ Step-by-Step Price Action Setup
Here’s how to trade this uptrend continuation with a bullish engulfing breakout correctly:
Identify the main structure:
Connect higher lows and higher highs to define the uptrend.
Spot the microchannel correction:
Look for a narrow downward pullback forming lower highs within the uptrend.
Wait for breakout confirmation:
A bullish engulfing candle breaking out of the microchannel signals the momentum shift.
Enter the trade:
Buy at the close of the engulfing candle.
Set stop loss:
Place it slightly below the engulfing candle’s low or the trendline support.
Determine the target:
Use the upper boundary of the main channel or previous high as the take-profit level.
Manage your risk:
Keep your risk/reward around 1:2 or better for consistent profitability.
This step-by-step framework keeps you focused on structure and confirmation, not emotion or prediction.
🧠 Trading Psychology — Patience and Confirmation
Many traders see a bullish candle and jump in immediately — but that’s emotion, not discipline.
The key difference between a retail trader and a professional is waiting for confirmation.
The bullish engulfing candle is not just a random green bar — it’s proof that buyers have regained control after a short-term correction.
By waiting for this confirmation instead of guessing the bottom, you align yourself with the real market momentum, not with hope.
Remember — the market rewards patience, not prediction.
If you treat every setup as a process of confirmation rather than assumption, your trading will become systematic and stress-free.
💬 Join the LinixBit Telegram Community
Want to see more setups like this one?
Join the LinixBit Telegram Community 👇
👉 https://t.me/linixbitt
Inside, you’ll find real-time chart discussions, short trade analyses, and a growing network of traders learning price action the right way — through structure, patience, and logic.
It’s completely free and built for traders who are serious about long-term growth and consistent learning.
🏁 Final Thoughts
This Buy or Sell? setup shows how clean structure and confirmation work together in trending markets.
Uptrend defines the main market direction.
Microchannel represents a temporary correction.
Bullish engulfing confirms the resumption of buying pressure.
Stop loss and target are placed logically around the trendline and resistance levels.
By following this method, you’re not reacting — you’re reading the chart with intention and precision.
That’s the mindset of a confident, price action-driven trader.
If you found this breakdown helpful, hit Like, Subscribe, and turn on notifications for more LinixBit trading lessons, chart analyses, and real-market price action setups designed to sharpen your strategy step by step.
#Trading #ForexTrading #CryptoTrading #PriceActionTrading #BuyOrSell #BullishEngulfing #UptrendSetup #TradingChallenge #ChartAnalysis #TechnicalAnalysis #PriceActionSetup #TrendContinuation #SmartTrading #RiskManagement #LearnToTrade #CandlestickPatterns #ChartPatterns #MarketStructure #ForexStrategy #CryptoStrategy #TradingPsychology #LinixBit #TradeSetup #TradingCommunity #BullishSetup #BreakoutTrading #DayTrading #SwingTrading


Информация по комментариям в разработке