SILVER'S $150 PROBLEM: Why The Mining Supply Gap Makes This Price Inevitable
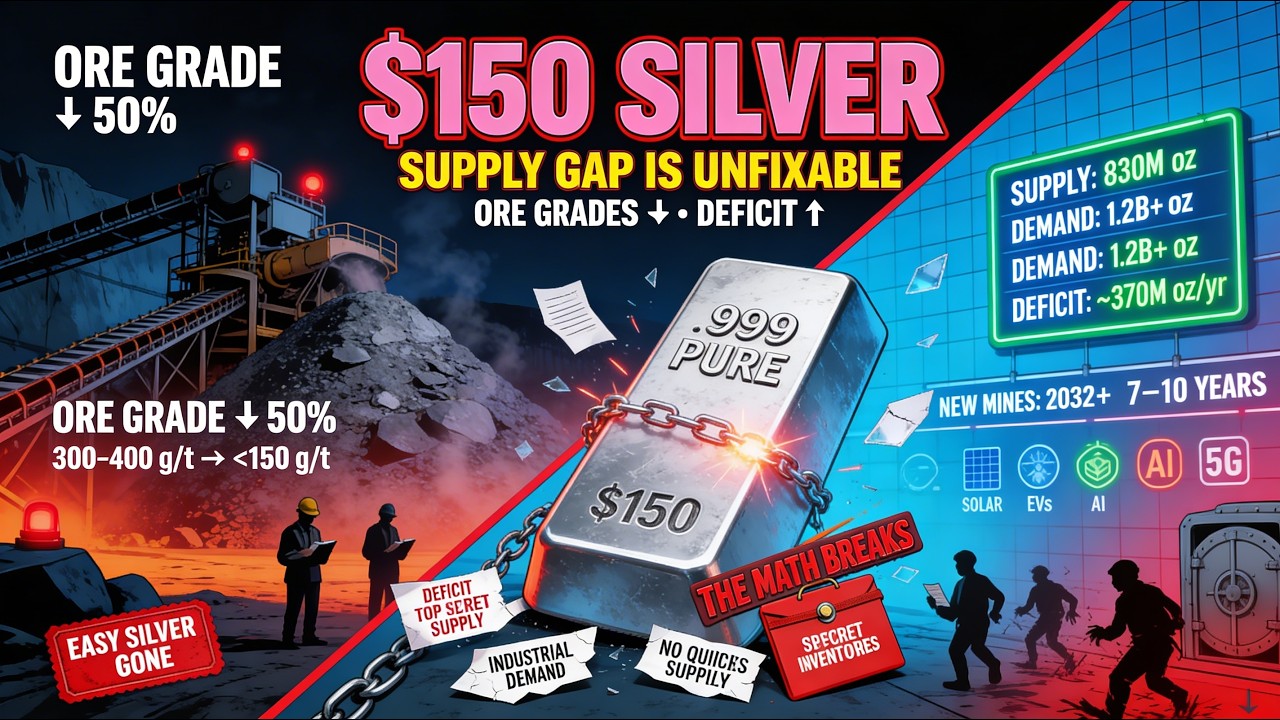
Global silver mine supply has been essentially flat near ~830M oz/year for six years, while total demand has climbed above 1.2B oz/year, producing an estimated ~370M oz annual structural deficit that has persisted for five consecutive years (Silver Institute data). Over the last two decades, average mined silver ore grades have fallen by 50%+, forcing miners to move roughly 2x the rock for the same ounce of metal – with dramatically higher energy, labor, water, and capex costs. Meanwhile, exploration budgets for silver were slashed during the 2015–2023 low-price era, leaving the project pipeline historically thin. With global PV (solar) demand ramping from ~100M oz/year (2020) to 200M+ oz (2024) and projected 250–350M+ oz by 2030, EV demand rising (25–50g per EV), and AI/data center, 5G, medical, and defense uses all expanding, the supply gap cannot be closed on any timeline shorter than 7–10 years – the minimum discovery-to-production window for new primary silver mines. Industry analysis suggests that only at $120–$150/oz do enough marginal projects become economic to attract capital, and even then, first ounces do not arrive until the 2030s. This video documents the structural supply gap, ore grade decline, under-investment in exploration, and industrial demand trajectory that together make $150 silver a geologic and economic floor, not a hype target. All data sourced from mining industry reports, Silver Institute publications, and public domain research. Educational analysis only. Not financial advice.
REFERENCE LINKS::::
Silver Institute – World Silver Survey (Supply/Demand & Deficits):
https://www.silverinstitute.org
USGS – Silver Commodity Summary & Ore Grade / Production Data:
https://www.usgs.gov/centers/national...
Global Mine Production / Country Shares (USGS):
https://www.usgs.gov/centers/national...
Solar PV Silver Demand – Industry & Academic Sources:
• International Energy Agency (IEA) – Renewables / PV reports:
https://www.iea.org
• University of New South Wales – PV Research (silver use trends):
https://www.unsw.edu.au/engineering/o...
Ore Grade Decline – Industry / Technical Publications:
(Search terms like “global silver ore grade decline” “average silver ore grades over time”)
EV Silver Usage – Silver Institute / Industry Data:
https://www.silverinstitute.org (industrial applications section)
DISCLAIMER::::
The content in this video is for educational and informational purposes only and represents my personal opinions and market analysis. It should not be considered professional financial, investment, legal, tax, or trading advice.
The silver and precious metals markets are volatile and subject to significant risks. The figures discussed in this video (global mine production, demand estimates, ore grades, exploration budgets, and cost ranges) are based on:
Publicly available data from the Silver Institute, USGS, IEA, and industry reports
My interpretation of how geological constraints and industrial demand interact over long timeframes
These data are estimates and subject to revision. Different analysts may calculate slightly different numbers based on methodology. Long‑range price “floors” such as $120–$150/oz are not predictions, but conceptual ranges where enough marginal projects are believed to become economic under current cost structures.
You should:
Independently verify any figures through the primary sources linked in the description
Conduct your own due diligence on miners, ETFs, and physical products
Consult a certified financial planner, registered investment advisor, or other qualified professional before making any investment decisions
I am not responsible for any financial losses or decisions made based on the information provided in this video.


Информация по комментариям в разработке