🔍 Is the Italian stock market heading for a crash?
In this in-depth analysis, we explore why the FTSE MIB Index — Italy’s leading stock index — is showing dangerous signs of overvaluation , extreme volatility , and systemic risk . Using advanced financial modeling techniques like Value at Risk (VaR) , Extreme Value Theory (EVT) , Jump-Diffusion Models , and GARCH volatility forecasting , we assess how deep and severe the next correction could be.
📌 Timestamps
00:00:00 – Introduction & Market Overview
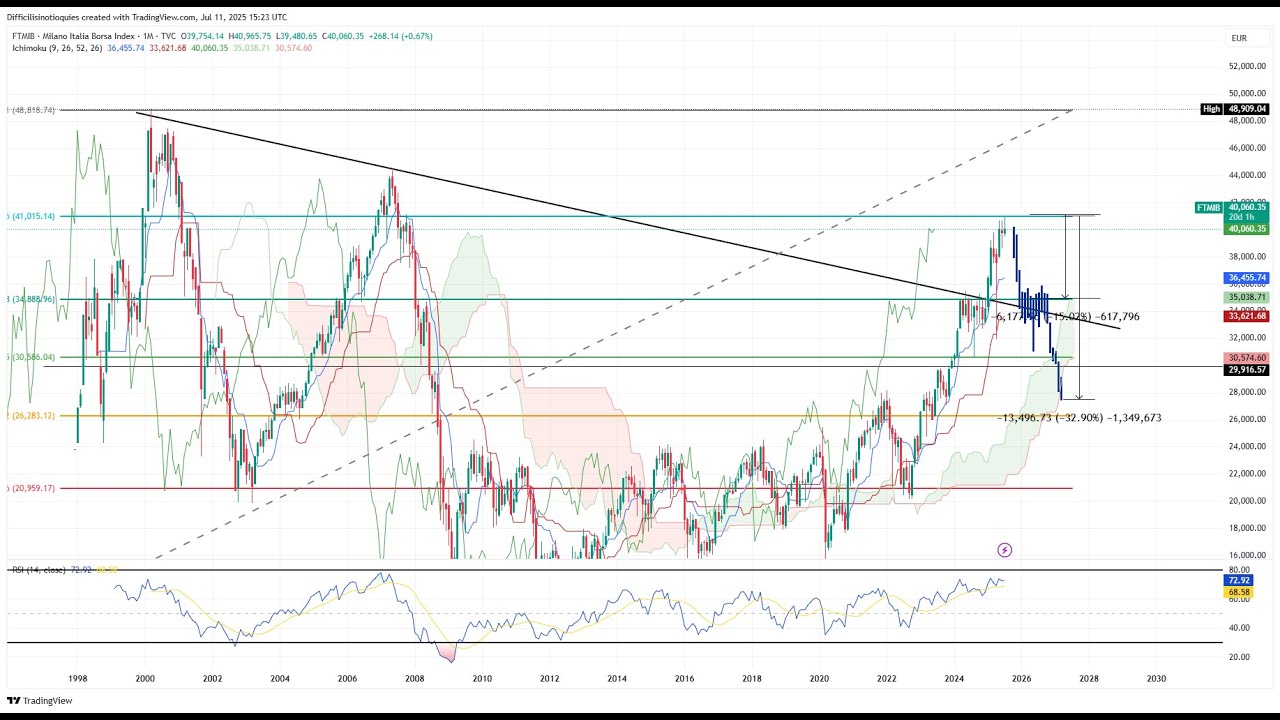
00:01:00 – Technical Analysis of FTSE MIB
00:08:00– Volatility and Seasonality trends in Stock Markets
00:11:00 – Jump Diffusion Model a Measure of Stocks' Volatility and Market Risk
00:14:00 – Volatility Parameters Summary Excel Data
00:40:00 – Value at Risk, EVT and POT Threshold , Market Tail risk extreme volatility event parameters. How to identify and manage tail risks.
01:09:00 – Stocks P/E Ratios and potential stock prices corrections
01:22:00 – Volatility Charts and GARCH Models Charts for Stocks
01:26:00 - Volatility Moving Average and Volumes how to identify tail risk
01:31:00 - Rolling Standard Deviations and Average Stock Drifts Charts
01:36:00 - Portfolio Construction: Equal Weighted, Risk Parity, Max Sharpe Ratio
📊 Based on our comprehensive backtesting and stress testing:
The FTSE MIB has historically experienced corrections of 25–75% during major market crashes
Current volatility levels are below median , suggesting a potential mean reversion
Many stocks show fat tails, high jump intensity , and negative skewness , indicating vulnerability to sudden drops
🔴 We analyze the top 10 most vulnerable stocks , including:
Campari (CPR.MI) – High volatility, negative jumps
Banca Monte dei Paschi di Siena (BMPS.MI) – Frequent drawdowns and poor capital preservation
Saipem (SPM.MI) – Energy exposure + extreme historical losses
UniCredit (UCG.MI) – Macro-sensitive banking risk
💡 This video is essential for:
Investors currently holding Italian equities
Portfolio managers assessing European risk
Traders looking to short or hedge exposure
Quant analysts interested in volatility modeling and crash prediction
📈 You’ll learn:
What drives market crashes in the FTSE MIB
How to estimate the probability and magnitude of a correction
Which stocks are most likely to drag down the index
How to protect your portfolio using risk parity , volatility targeting , and defensive utilities
🛠️ We use real-world data, Python-based simulations, and statistical models to build a bearish case for the Italian market based on:
Historical max drawdowns
Jump-diffusion parameters
Tail risk metrics (EVT VaR and Expected Shortfall)
Market cap-weighted contagion effects
Fire sale scenarios and liquidity crunches
📌 If you're investing in Italian stocks or ETFs tracking the FTSE MIB Index, now is the time to reassess your exposure before the next big move.
⭐ Subscribe for More
🔔 Don’t forget to subscribe and hit the bell icon to get notified when we release new videos on:
European market risks
Quantitative finance and algorithmic trading
Portfolio optimization and risk management
Stock-by-stock breakdowns of global equities
🧠 Tags
#FTSEMIB, #ItalyStockMarket, #MarketCrash, #ValueAtRisk, #EVT, #JumpDiffusion, #GARCH, #PortfolioRisk, #ItalianBanks, #StockMarketAnalysis, #FinancialModeling, #QuantitativeFinance, #MarketCorrection, #StockMarketCrashPrediction
#stockmarket #οικονομικά
Listen for Free to The Podcast :
//open.spotify.com/show/7puiUZxpDb7DT5rYOnIkmk?si=efcc3ea01f304b19
Read for Free and enjoy the Journal with the latest most important facts you need to know about economics and global markets:
https://capitalmarketjournal.com/

Информация по комментариям в разработке