Earn 18 SHRM PDCs for SHRM-CP or SHRM-SCP.
15-16 June | 22-23 June | 29-30 June 2024
Contact Meritt Learning Center
[email protected]; +91-7428466822; www.merittconsultants.com
Instructor-Led Virtual Zoom Session
18 Hours Session
15-16 June | 22-23 June | 29-30 June 2024
Time: 2:30 pm - 5:30 pm
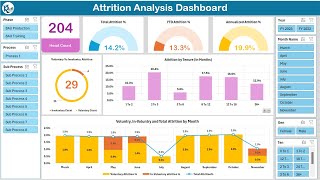
Learn to create HR Excel Dashboard, Strategy Map, Balanced Scorecard, HR Scorecard, KPI Dashboard, Recruitment Dashboard, Retention Dashboard, Reporting Trends in Graphs, Chart, Table, Metrics Calculations, Data Analysis, Regression and Correlation Analysis, Factor Analysis, Cluster Analysis, Statistical Analysis, Benchmarking, Predictive Analytics, etc. Analyze HR data in Microsoft Excel (Pivot Table and Charts) and build intuitive dashboards using Microsoft Power BI.
PROGRAM AGENDA
Live Virtual Sessions (18 Hours) with Practical Exercises and Assignments
Session 1 : Business and HR Analytics
15 June (Sat)
Introduction to Business Analytics, Fundamentals of HR Analytics, Evolution of HR Analytics and Scope of Human Analytics in Business.
Evolution of Human Analytics:
Quantification Methods, Establishing the Analytic Framework, Need for Standards in HR Analysis, Basic Data Analytic Techniques using Excel.
Session 2 : Strategy Maps and Balance Score Cards
16 June (Sun)
HR as Strategic Drivers, Human Capital Reporting Standards, Using Data to Develop Operational Frameworks, Developing HR Measures.
Developing HR Metrics and Score Cards:
Choosing the Correct Metrics, Identifying the Key HR Processes for Business Developing HR Score Cards, Applying of HR Score Cards.
Session 3 : Data Quantification and Analytic Techniques
22 June (Sat)
Linking HR with Business Drivers, Business Drivers Framework, Using Strategy Maps for Business, Balance Score Card Method.
Statistical Analysis and Benchmarking:
Statistical Analysis for Reporting, Benchmarking and Targets Linkage and Trends Analysis, Human Capital Measures and Business Results.
Session 4 : Advanced Analytics and Predictive Outcomes
23 June (Sun)
Statistical Drivers and Advanced Analytics, Correlation and Causations, Using Regression and Data Analysis for Predicting Business Outcomes.
Regression and Correlation Measures:
Communicating with Data and Visuals, Selecting of Proper Charts and Diagrams, Dash Boards and Score Cards for Best Business Outcomes.
Session 5 & 6 : Data visualization – In Microsoft Excel and Power BI
29-30 June (Sat - Sun)
Learn the skills to analyze HR data in Microsoft Excel and build intuitive dashboards using Microsoft Power BI.
Learn to communicate data effectively by creating compelling reports and using storytelling techniques. Learn end to end Power BI Dashboard.
Create Interactive dashboards.
Data Storytelling & Project outcomes.
Contact Meritt Learning Center
[email protected]; +91-7428466822; www.merittconsultants.com
Instructor Led Virtual Zoom Session


![Visual Calculations in Power BI - DAX Made Easy! [Full Course]](https://i.ytimg.com/vi/JITM2iW2uLQ/mqdefault.jpg)


Информация по комментариям в разработке