Candlestick Patterns Revealed: Read Order Flow Like a Pro
CANDLESTICK ANALYSIS AND CANDLESTICK PATTERNS FOR BEGINNERS. In today's video we teach the basics of candlestick analysis so that you can recognize the candlestick patterns that offer the greatest potential for profitable trades. Candlestick analysis has hundreds of different chart patterns, in this video we break them down to the only four you need.
I. Introduction (0:00 - 1:15)
Overview of the video's purpose and what will be covered
II. Goals of the Module (1:16 - 2:27)
Introduce candlestick charts and order flow
Explain basic candlestick patterns
Train viewers to identify setups for swing trading
III. Understanding Candlestick Charts (2:28 - 5:19)
Candlesticks represent supply and demand
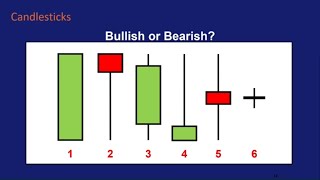
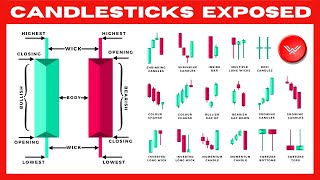
Components of a candlestick (body, wick, color)
Candlestick charts across different time frames
IV. Candlestick Patterns (5:20 - 19:35)
Energy candlesticks (bullish and bearish)
Melted candlesticks (indecision)
Inside candlesticks (pause in price action)
Well-bid and well-offered candlesticks (bullish and bearish order flow)
Bullish and bearish U-turns (short-term reversals)
Order flow in multiple time frames
V. Recap and Examples (19:36 - 25:17)
Summary of candlestick patterns
Examples of patterns in different stocks (Apple, PayPal, Caterpillar, Goldman Sachs)
Importance of combining order flow across time frames
SEO-optimized summaries for each main section:
I. Introduction:
Discover the only candlestick patterns you need to understand smart money activity in the stock market. This video provides a comprehensive guide to reading candlestick charts, spotting buying and selling pressure, and making profitable trading decisions with confidence.
II. Goals of the Module:
Learn to introduce candlestick charts, understand order flow (buying and selling pressure), identify basic candlestick patterns, and train yourself to spot swing trading setups. This module equips you with the foundation for reading charts like a pro and capitalizing on high-probability trade ideas.
III. Understanding Candlestick Charts:
Candlestick charts offer a visual representation of supply and demand in the stock market. Understand the components of a candlestick (body, wick, color) and how they reflect the interaction between buyers and sellers. Explore candlestick charts across different time frames (1-minute, daily, weekly, monthly) and their significance for active traders.
IV. Candlestick Patterns:
Dive into the most critical candlestick patterns for identifying smart money activity. Learn to recognize energy candlesticks (bullish and bearish), melted candlesticks (indecision), inside candlesticks (pause in price action), well-bid and well-offered candlesticks (bullish and bearish order flow), and bullish/bearish U-turns (short-term reversals). Discover how to combine order flow across multiple time frames for high-probability trade setups.
V. Recap and Examples:
Reinforce your understanding of candlestick patterns with a comprehensive recap and real-world examples from stocks like Apple, PayPal, Caterpillar, and Goldman Sachs. See how combining order flow across time frames (monthly, weekly, daily, intraday) can stack the odds in your favor for successful swing trading.
💰Watch Now: How I Generate Outsized Gains💰
https://stocktradingpro.com/accelerator
💰Pete Renzulli | Stock Trading Pro 💰
Join us Monday's 7:30 AM: Stocks For Breakfast
Be sure to SUBSCRIBE to the channel and hit the LIKE button for updates. #peterenzulli #stocktradingpro #stocks
💰Follow Me on Twitter: / peterenzulli 💰
Stock Trading Pro and Pete Renzulli may receive compensation for recommending these high-quality products and services from these 3rd-parties that we trust.
Contact:
[email protected]
Disclaimer:
https://stocktradingpro.com/disclaimer/
#stockmarket #beststockstobuynow #stockstobuy #stockpicks #tsla #stockmarketnews
These YouTube stock market live stream videos are for financial education purposes. It's up to you to consult your financial advisor to make the final decision before you decide which stocks to buy
candlestick charts, candlestick charts - technical analysis series, candlestick charts for dummies, candlestick charts for day trading, candlestick charts youtube, candlestick charts live, candlestick charts in excel, candlestick charts bitcoin, candlestick charts steve nison, candlestick charts and patterns, candlestick charts sharekhan, candlestick charts clive lambert, how to read candlestick charts tagalog, how to read candlestick charts robinhood


Информация по комментариям в разработке