#StockMarket #TradingTools #OptionsTrading #IntradayTrading #PriceAction #Nifty #BankNifty #TradingStrategy #TraderLife #StockMarketIndia #LearnTrading #TechnicalAnalysis #CapitalProtection #RiskManagement #WhyTradersFail #ProfitBooking #SmartTrading #TradingTips #TradingEducation
Download OCA – Option Chain Analysis now from Google Play Store:
https://play.google.com/store/apps/de...
Unlock the power of options trading with OCA – Option Chain Analysis App! 📈 Whether you’re a beginner or a professional trader, OCA gives you real-time option chain data, max pain calculation, open interest (OI) analysis, and trend insights to make smarter trading decisions.
With OCA, you can:
✅ Analyze call and put options for every strike
✅ Track max pain levels and potential market movements
✅ Spot big player OI trends instantly
✅ Make informed decisions for intraday, swing, or long-term trades
✅ Access fast, ad-supported, and user-friendly interface
Stop guessing and start trading with confidence!
The video introduces the Option Chain Analysis (OCA) app, a trading intelligence platform designed to help traders make informed decisions.
Key features and functionalities of the app include:
Main Dashboard (0:06-1:06): Provides live data for Nifty and Bank Nifty, including real-time price movements, change points, and percentage variations. It also offers a market strength panel (0:21) for overall momentum and a market direction view (0:34) to identify current trends. Trending strikes (0:48) highlight active calls and puts options.
Screener Activity (1:17-2:07): An exclusive feature for subscribers, this provides real-time insights by tracking changes in open interest (OI), change in OI, and the difference value between calls and puts. It features an auto-refresh option for live updates every 30 seconds.
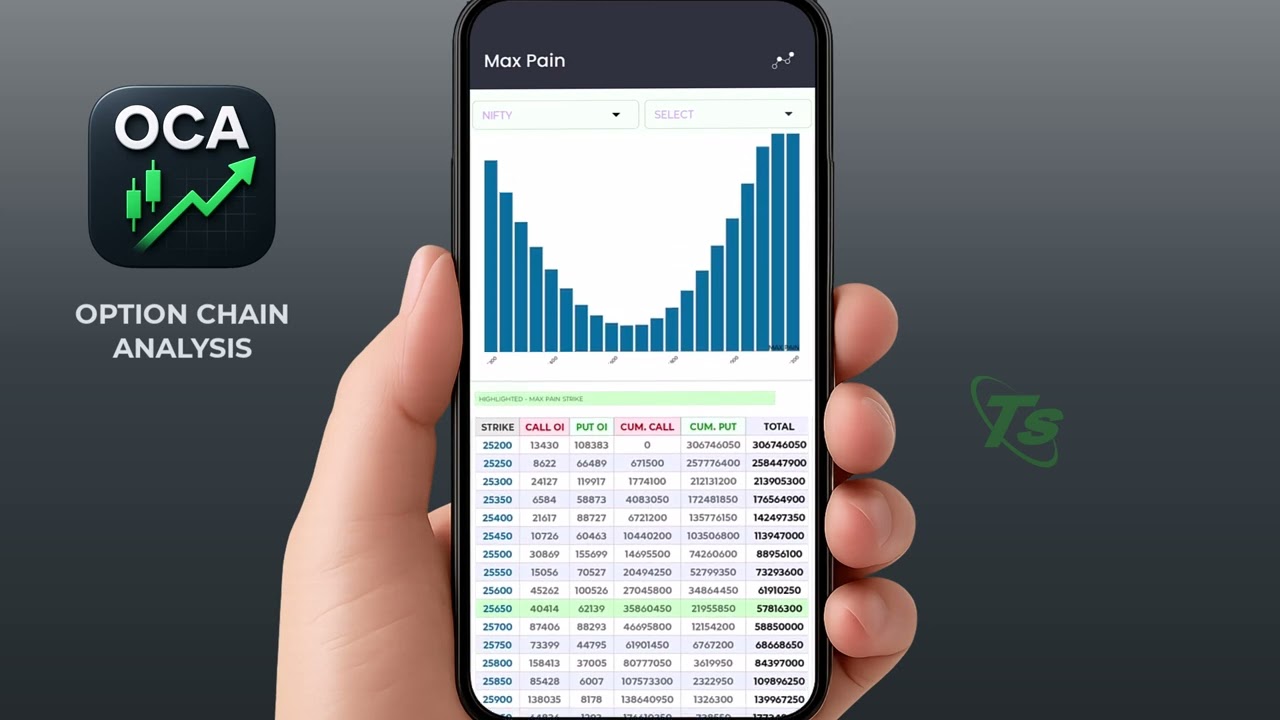
Max Pain Activity (2:11-3:43): A powerful tool to identify the "max pain strike," where option buyers experience the most loss and option sellers find the highest advantage. It displays underlying asset details (2:28), separate sections for option buyers (2:45) and sellers (2:53), an OI summary table (3:01), a max pain graph (3:13), and a cumulative OI table (3:24).
Main Option Chain Analysis Activity (3:51-4:50): Offers a dynamic snapshot of the market, blending price action, open interest, and volume to reveal trader sentiment and positioning. It helps identify resistance and support zones and confirms where trading action is heating up.
The video emphasizes that OCA provides real-time data, actionable insights, and automation to simplify market analysis and help traders stay ahead of the curve (1:01, 2:00, 3:35, 4:48). The app is available for download on the Google Play Store (4:52)
Why traders lose money, why 90% traders lose, trading mistakes, best trading tool, capital protection, stock market tool, risk management in trading, option chain analysis, stock market education, intraday trading tips, how to trade safely, options trading strategy, technical analysis for beginners, avoid losses in trading, trading for beginners, stock market India, nifty trading tool, bank nifty strategy, trading psychology, why traders fail, profitable trading strategy, learn stock market, trading tools for beginners, best trading strategy 2025

Информация по комментариям в разработке