Welcome to our comprehensive comparison of Grafana and Prometheus, two powerful monitoring tools commonly used in DevOps environments. In this video "📊 Grafana vs. Prometheus: 5 Key Features and 4 Crucial Differences | DevOps Monitoring Tools 🚀", we'll delve into the five key features and four crucial differences between these tools to help you make informed decisions for your monitoring setup.
Whether you're a seasoned DevOps professional or just getting started with monitoring tools, this comparison will provide valuable insights into choosing the right solution for your infrastructure.
Grafana:
Visualization Tool:
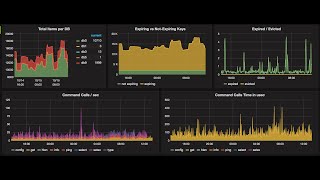
Grafana is primarily a visualization tool used for creating dashboards and graphs to display metrics and data from various sources.
Features:
Grafana offers a wide range of features for data visualization, including customizable dashboards, dynamic graphs, alerts, and annotations.
Data Sources:
Grafana can connect to various data sources such as Prometheus, Graphite, InfluxDB, Elasticsearch, and more, making it versatile for different
Use cases.
User-Friendly Interface:
Grafana provides an intuitive and user-friendly interface with drag-and-drop functionality for designing dashboards and configuring visualizations.
Community and Plugins:
Grafana has a large and active community that develops plugins and extensions, allowing users to extend its functionality and integrate with other tools and services.
Prometheus:
Monitoring and Alerting Tool:
Prometheus is primarily a monitoring and alerting tool used for collecting, storing, and querying time-series data.
Pull-Based Model:
Prometheus follows a pull-based model where it scrapes metrics data from instrumented targets such as applications, servers, and containers at regular intervals.
Metrics Collection:
Prometheus supports multiple modes of metric collection, including HTTP, DNS, and SNMP, making it flexible for monitoring various types of systems and services.
Query Language:
Prometheus Query Language (PromQL) allows users to perform powerful queries and aggregations on collected metrics data for analysis and visualization.
Alerting Rules:
Prometheus allows users to define alerting rules based on metric thresholds and conditions, triggering alerts and notifications when certain criteria are met.
Comparison:
Use Cases:
Grafana is best suited for visualizing and analyzing metrics data, whereas Prometheus excels in collecting, storing, and querying time-series data for monitoring and alerting purposes.
Integration:
Grafana can be integrated with Prometheus as a data source to visualize metrics collected by Prometheus, providing a seamless monitoring and visualization solution.
Functionality:
While Grafana focuses on visualization and dashboarding, Prometheus is more focused on metrics collection, storage, and alerting, with a powerful querying language.
Flexibility:
Grafana is more flexible in terms of data sources and visualization options, while Prometheus offers more advanced monitoring and alerting capabilities out of the box.
Don't forget to like, share, and subscribe for more informative content on DevOps tools and practices!
Keywords:
grafana
prometheus
what is grafana
what is prometheus
prometheus grafana
Grafana vs Prometheus
Monitoring Tools in DevOps
Grafana features
Prometheus features
Grafana vs Prometheus differences
Grafana tutorial
Prometheus tutorial
DevOps monitoring comparison
Grafana monitoring
Prometheus monitoring
prometheus for beginners
grafana for beginners
prometheus tutorials
grafana tutorials
cloudnixiass
prometheus monitoring,monitoring,prometheus monitoring tutorial,prometheus monitoring with grafana,devops tools,prometheus,grafana,what is prometheus monitoring,prometheus and grafana monitoring,grafana prometheus,prometheus tutorial,prometheus monitoring tool,what is prometheus monitoring tool,grafana tutorial,monitoring tools in devops,prometheus monitoring tutorial for beginners,prometheus monitoring demo,grafana prometheus dashboard tutorial
#grafana
#prometheus
#whatisgrafana
#wahtisprometheus
#cloudnixiass
#devops
#monitoringtools
#dashboard
#visualization
#grafanavsprometheus
#prometheustutorial
Video links:
https://grafana.com/
https://prometheus.io/
Easy Grafana Installation Guide for Windows | Step-by-Step Tutorial: • Easy to Install and use Grafana in Wi...
Easy to Install Grafana On Windows | Learn Grafana: • Easy to Install Grafana On Windows | ...
What are Exporters in Prometheus?: • What are Exporters in Prometheus?
What is PromQL? | Prometheus Query Language: • What is PromQL? | Prometheus Query La...
How to install Prometheus In Windows 10?: • How to install Prometheus In Windows 10?
What is prometheus: Efficient Time Series Database Open Source & Famous Monitoring Tool: • What is prometheus: Efficient Time Se...


Информация по комментариям в разработке