Learning current Silicon Valley real estate market conditions. Helps consumers, buyers, sellers, homeowners, investors, agents understand current local real estate market without sales hype using key metrics
• Turn-Over Time | Supply/Demand Balance
• Marketing Time
• Sellers’ Ask Price Reductions
• Buyers’ Overbidding
• Appreciation 2015 & 2020
• Sold Prices: low - typical - high
• Offers Accepted (not pending)
• Active inventory (no contract)
TIME STAMPS & descriptions
00:00 INTRO & RECAP Silicon Valley Real Estate Market - slide 1
00:34 KEY METRICS Turn-Over Time aka Supply/Demand Balance, Offers Accepted, Active Inventory versus their typical levels over past 10 years. - slide 2-4
04:06 QUARTERLY DATA previous & next a) #Supply/Demand balance b) Market time c) Seller's #PriceReductions d) Buyer's #Overbidding e) Active Inventory f) #Offers Accepted - slide 5
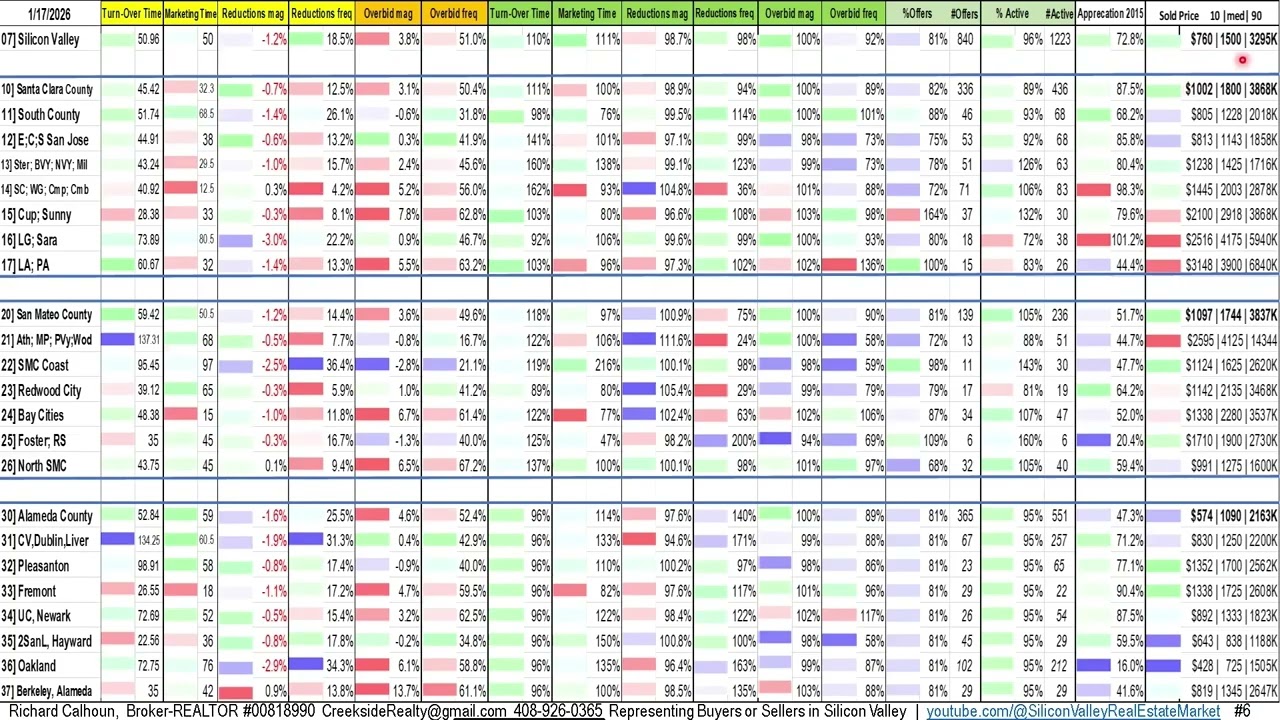
10:23 20 MICRO-MARKET TABLE comparing both current values and comparison to their typical value for the past 10 years. - slide 6
13:09 WEEK'S HEAT MAPS a geographically display of 20 micro-markets - a) Supply/Demand balance (turn over time), b) Typical Marketing Time (time for 3/4ths to sell), c) Seller Ask Price Reductions (magnitude & frequency), d) Buyer Overbidding (magnitude & frequency), e) Appreciation, f) Sold Price, g) Offers Accepted versus Pending Transactions, h) Active Inventory. - slides 8-23
21:50 DATA GRAPHS Silicon Valley a) Seller/Buyer balance, b) Marketing time, c) Ask Price Reductions, d) Buyer Overbidding, e) Sold Price (low-middle-high), f) PITI payment, g) Active Inventory, h) Offers Accepted. - slides 26-43
28:22 CONTRASTING 3 COUNTIES Santa Clara County, San Mateo County, & Alameda County: a) Days of Inventory, b) Days on Market, c) Price Reductions, d) Overbidding, e) Appreciation, f) Sold Price, g) PITI payment past 10 years h) Active Inventory, i) Accepted Offers. - slides 45-56
32:45 TABULAR DATA - Silicon Valley, Santa Clara, San Mateo, & Alameda County. - slide 57-58
34:28 How to PARTICIPATE LIVE, ask questions, past presentations, URLs. - slide 59
36:15 DISTRIBUTIONS MARKETING TIME (days on market) over past year. - slides 62-93
38:06 DISTRIBUTIONS PRICE REDUCTIONS over past year. - slides 94-125
39:50 DISTRIBUTIONS OVERBIDDING (Market Competitiveness) (over past year. - slides 126-157
40:55 GREATER BAY AREA 5 Regions 13 Counties a) Seller/Buyer balance, b) Typical Marketing time, c) Seller’s Ask Price Reductions, d) Buyer’s Overbidding, e) Sold Price (low-middle-high), f) Appreciation since 2015, g) Active Inventory, h) Offers Accepted not pending transactions. - slides 159-169
45:23 TABULAR DATA - Northern California 13 counties - current raw data, percent change from 1 and 5 weeks ago. - slide 170
About the Presenter: Richard Calhoun, Realtor & Real Estate Broker DRE-00818990 [email protected] With 45 years of local Silicon Valley experience, Richard helps buyers and sellers achieve their real estate goals.
This presentation is a weekly recap through 11:59 PM Friday 1/16/2026, utilizing a graphical presentation of the annual seasonal trends over the past decade and geographical format featuring the current week's conditions for 20 micro-markets within Silicon Valley. We also compare Santa Clara, San Mateo, and Alameda Counties, along with distributions on Marketing Time, Price Reductions, and Overbidding for the past year. We conclude with a comprehensive look at the Northern California Greater Bay Area using five regions and covering 13 counties.
• Obtain the 73 page PDF of this week's slides: tinyurl.com/SVREMH20260117
Change the YYYYMMDD code above using any Saturday.
Join our live Zoom presentation Saturday mornings at 9 AM PDT!
• Method 1: tinyurl.com/SVREM2026
• Method 2: https://us04web.zoom.us/s/78639492724... (pass code if needed = 2jdw2f)
• Method 3: Zoom account using Meeting ID: 786 3949 2724 password 2jdw2f

Информация по комментариям в разработке