At 14:46 on the afternoon of 11 March 2011 (05:46 UTC), a 9.0 moment magnitude earthquake struck near the coastline of Honshu, Japan. The Pacific Tsunami Warning Center (PTWC) quickly determined that the very large magnitude of this earthquake, its offshore location, its relatively shallow depth within the earth, and a history of megathrust earthquakes in the region meant that it likely moved the seafloor and thus posed a significant tsunami risk. As per international agreements Japanese authorities issued tsunami warnings for their own coastlines while PTWC began issuing warnings to other countries and territories in the western Pacific Ocean. The earthquake did in fact cause a tsunami, and over the following hours as PTWC learned more about the earthquake (confirming it was a megathrust and upgrading its magnitude) and its tsunami through forecast models and direct observation with DART sensors and coastal sea-level gauges PTWC would eventually issue tsunami warnings to the State of Hawaii and all remaining countries and territories participating the Pacific Tsunami Warning System, keeping warnings in some areas in effect for more than a day. PTWC’s sister office, the West Coast and Alaska Tsunami Warning Center (now known as the National Tsunami Warning Center), also issued tsunami warnings for Alaska and the Pacific coasts of the United States and Canada. The tsunami caused the greatest devastation and over 17,000 deaths in Japan, where waves reached over 40 m or 130 ft. high. Outside of Japan the tsunami also killed one person in Papua, Indonesia and rose to greater than 5 m or 16 ft. in the Galapagos Islands (Ecuador), greater than 2m or 6.5 ft. in Indonesia, Russia's Kuril Islands, and in Chile, and rose to greater than 1 m or 3 ft. in Costa Rica, the Marquesas Islands (French Polynesia), Mexico, Papua New Guinea, and Peru. In the United States the tsunami rose to more than 5 m or 16 ft. in Hawaii, more than 2 m or 6.5 ft in California and Oregon, and more than 1 m or 3 ft. in the U.S. island territories of Midway and Saipan (Northern Mariana Islands). The tsunami also killed one person in Crescent City, California.
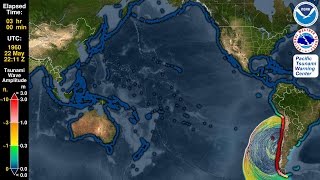
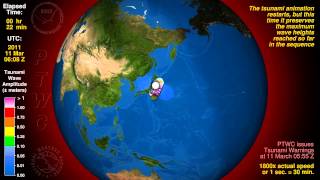
The Pacific Tsunami Warning Center (PTWC) can create an animation of a historical tsunami like this one using the same tool that it uses to determine tsunami hazards in real time for any tsunami today: the Real-Time Forecasting of Tsunamis (RIFT) forecast model. The RIFT model takes earthquake information as input and calculates how the waves move through the world’s oceans, predicting their speed, wavelength, and amplitude. This animation shows these values through the simulated motion of the waves and as they travel through the world’s oceans one can also see the distance between successive wave crests (wavelength) as well as their height (half-amplitude) indicated by their color. More importantly, the model also shows what happens when these tsunami waves strike land, the very information that PTWC needs to issue tsunami hazard guidance for impacted coastlines. From the beginning the animation shows all coastlines covered by colored points. These are initially a blue color like the undisturbed ocean to indicate normal sea level, but as the tsunami waves reach them they will change color to represent the height of the waves coming ashore, and often these values are higher than they were in the deeper waters offshore. The color scheme is based on PTWC’s warning criteria, with blue-to-green representing no hazard (less than 30 cm or ~1 ft.), yellow-to-orange indicating low hazard with a stay-off-the-beach recommendation (30 to 100 cm or ~1 to 3 ft.), light red-to-bright red indicating significant hazard requiring evacuation (1 to 3 m or ~3 to 10 ft.), and dark red indicating a severe hazard possibly requiring a second-tier evacuation (greater than 3 m or ~10 ft.).
Toward the end of this simulated 36 hours of activity the wave animation will transition to the “energy map” of a mathematical surface representing the maximum rise in sea-level on the open ocean caused by the tsunami, a pattern that indicates that the kinetic energy of the tsunami was not distributed evenly across the oceans but instead forms a highly directional “beam” such that the tsunami was far more severe in the middle of the “beam” of energy than on its sides. This pattern also generally correlates to the coastal impacts; note how those coastlines directly in the “beam” are hit by larger waves than those to either side of it.
-----
Earthquake source used: USGS NEIC Finite Fault Model
http://earthquake.usgs.gov/earthquake...
For a NOAA Science on a Sphere version of this animation, please see:
http://sos.noaa.gov/Datasets/dataset....


Информация по комментариям в разработке