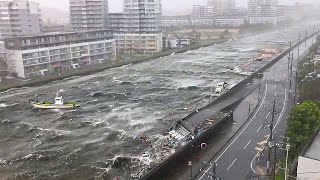
On May 22, 1960, at 3:11 pm (19:11 UTC) the largest earthquake ever recorded by instruments struck southern Chile with a magnitude we now know to be at least 9.5. This earthquake generated a tsunami that traveled through every ocean on earth, though large, dangerous waves only impacted the coastlines around the Pacific Ocean. Chile suffered the greatest impact, with tsunami waves reaching as high as 25 m or 82 ft., killing an estimated 2000 people there. Outside of Chile the tsunami was worst on the opposite side of the planet in Japan, where waves reached as high as 6.3 m or over 20 ft and killed 139 people. In between and halfway across the Pacific Ocean Hawaii suffered the second-worst tsunami in its recorded history--only the Aleutian Islands tsunami of 1946 was worse. It killed 61 people in the town of Hilo with waves reaching as high as 10.7 m or about 35 ft. and all Hawaiian Islands experienced waves well over 1 m or 3 ft. The Philippines also lost 21 people to waves recorded as high as 1.5 m or nearly 5 ft, and two more people died in California from waves reaching 2.2 m or over 7 ft. high. Elsewhere around the Pacific Ocean tsunami waves reached as high as 12.2 m or 40 ft at Pitcairn Island (U.K), 7.0 m or 23 ft. in Russia (Kamchatka), 5.0 m or over 16 ft. in New Zealand, 4.9 m or 16 ft. in (Western) Samoa, 2.4 m or about 8 ft. in French Polynesia, 2.1 m or 7 ft. in Canada, 1.8 m or about 6 ft. in Papua New Guinea, and 1.2 m or about 4 ft. in Mexico. In the United States and it territories 2.4 m or about 8 ft. in American Samoa, 2.3 m or 7.5 ft. in Alaska, and 1.8 m or about 6 ft. in Oregon.
A global tsunami warning system did not exist in 1960 and the Honolulu Magnetic and Seismic Observatory, which would later become the Pacific Tsunami Warning Center (PTWC), did issue tsunami warnings for this earthquake to the State of Hawaii many hours in advance of its arrival (it would take almost 15 hours for the first wave to reach Hawaii). As a result of this tsunami the United Nations would set up the Pacific Tsunami Warning System (PTWS) in 1965 with the Honolulu Observatory as its headquarters.
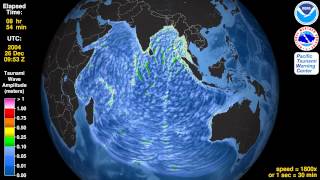
Today, more than 50 years since the Great Chile Earthquake and the establishment of the PTWS, the PTWC will issue tsunami warnings in minutes, not hours, after a major earthquake occurs, and will forecast how large any resulting tsunami will be as it is still crossing the ocean. The PTWC can also create an animation of a historical tsunami with the same tool that it uses to determine tsunami hazards in real time for any tsunami today: the Real-Time Forecasting of Tsunamis (RIFT) forecast model. The RIFT model takes earthquake information as input and calculates how the waves move through the world’s oceans, predicting their speed, wavelength, and amplitude. This animation shows these values through the simulated motion of the waves and as they travel through the world’s oceans one can also see the distance between successive wave crests (wavelength) as well as their height (half-amplitude) indicated by their color. More importantly, the model also shows what happens when these tsunami waves strike land, the very information that the PTWC needs to issue tsunami hazard guidance for impacted coastlines. From the beginning the animation shows all coastlines covered by colored points. These are initially a blue color like the undisturbed ocean to indicate normal sea level, but as the tsunami waves reach them they will change color to represent the height of the waves coming ashore, and often these values are higher than they were in the deeper waters offshore. The color scheme is based on the PTWC’s warning criteria, with blue-to-green representing no hazard (less than 30 cm or ~1 ft.), yellow-to-orange indicating low hazard with a stay-off-the-beach recommendation (30 to 100 cm or ~1 to 3 ft.), light red-to-bright red indicating significant hazard requiring evacuation (1 to 3 m or ~3 to 10 ft.), and dark red indicating a severe hazard possibly requiring a second-tier evacuation (greater than 3 m or ~10 ft.).
Toward the end of this simulated 36 hours of activity the wave animation will transition to the “energy map” of a mathematical surface representing the maximum rise in sea-level on the open ocean caused by the tsunami, a pattern that indicates that the kinetic energy of the tsunami was not distributed evenly across the oceans but instead forms a highly directional “beam” such that the tsunami was far more severe in the middle of the “beam” of energy than on its sides. This pattern also generally correlates to the coastal impacts; note how those coastlines directly in the “beam” are hit by larger waves than those to either side of it.
----------
Earthquake source used:
Fujii, Y. and K. Satake, Slip Distribution and Seismic Moment of the 2010 and 1960 Chilean Earthquakes Inferred from Tsunami Waveforms and Coastal Geodetic Data, Pure and Applied Geophysics, 170, 1493-1509, 2012


Информация по комментариям в разработке